1.2- NLP: Analisis del Sentimiento con Naïve Bayes
Procesamiento del lenguaje natural con Clasificación y Espacios Vectoriales
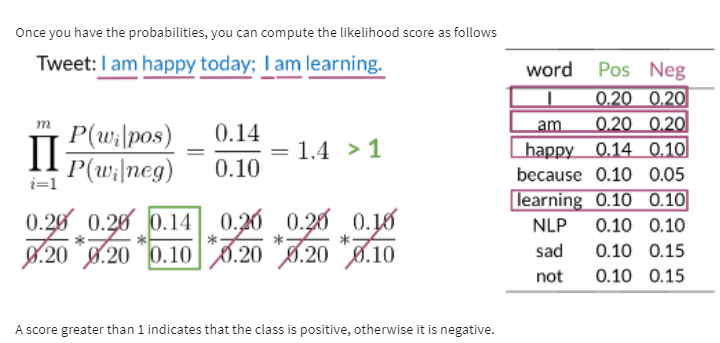
- Teorema de Bayes
- Método Naive Bayes (Bayes ingenuo)
- Suavizado Laplaciano (Laplacian Smoothing)
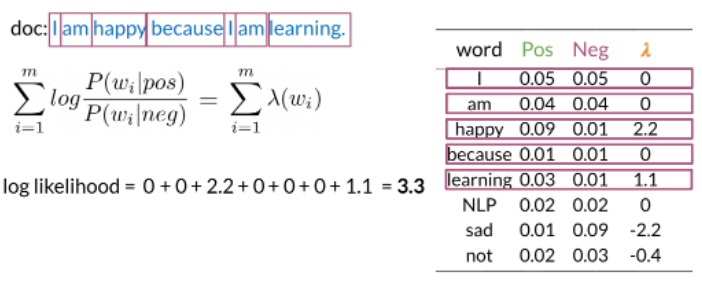
- Logaritmo de la probabilidad (Log Likelihood)
- Visualizando Naive Bayes
- Entrenando naïve Bayes
- Probar el modelo
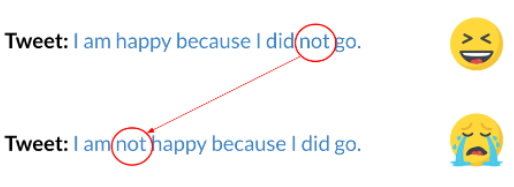
- Errores que podrían causar que clasifiques mal un ejemplo o un tweet:
Teorema de Bayes
Calcula la probabilidad de que ocurra un evento A aleatorio en el caso de que ha ocurrido otro B. +info


Aplicaciones:
- Identificación del autor
- Filtrado de spam
- Recuperación de información
- Desambiguación de palabras
Naïve Bayes toma una suposición de independencia: si tuviera que completar la oración "Siempre hace frío y nieve en __", este modelo ingenuo asignará el mismo peso a las palabras "primavera, verano, otoño, invierno".


-> log prior + log likelihood

import numpy as np # Library for linear algebra and math utils
import pandas as pd # Dataframe library

import matplotlib.pyplot as plt # Library for plots
data = pd.read_csv('./data/bayes_features.csv'); # Load the data from the csv file

data.head(5) # Print the first 5 tweets features. Each row represents a tweet
fig, ax = plt.subplots(figsize = (8, 8))

colors = ['red', 'green'] # Define a color palete
sentiments = ['negative', 'positive']
index = data.index

# Color base on sentiment
for sentiment in data.sentiment.unique():
    ix = index[data.sentiment == sentiment]
    ax.scatter(data.iloc[ix].positive, data.iloc[ix].negative, c=colors[int(sentiment)], s=0.1, marker='*', label=sentiments[int(sentiment)])

# Custom limits for this chart
plt.xlim(-200,40)
plt.ylim(-200,40)

plt.xlabel("Positive") # x-axis label
plt.ylabel("Negative") # y-axis label

data_pos = data[data.sentiment == 1] # Filter only the positive samples
data_neg = data[data.sentiment == 0] # Filter only the negative samples

ax.legend(loc='lower right')

plt.show()
In the next cell, we will modify the features of the samples with positive sentiment (1), in a way that the two distributions overlap. In this case, the Naïve Bayes method will produce a lower accuracy than with the original data.
data2 = data.copy() # Copy the whole data frame

# The following 2 lines only modify the entries in the data frame where sentiment == 1
data2.negative[data.sentiment == 1] =  data2.negative * 1.5 + 50 # Modify the negative attribute
data2.positive[data.sentiment == 1] =  data2.positive / 1.5 - 50 # Modify the positive attribute
fig, ax = plt.subplots(figsize = (8, 8))

colors = ['red', 'green'] # Define a color palete
sentiments = ['negative', 'positive']
index = data2.index

# Color base on sentiment
for sentiment in data2.sentiment.unique():
    ix = index[data2.sentiment == sentiment]
    ax.scatter(data2.iloc[ix].positive, data2.iloc[ix].negative, c=colors[int(sentiment)], s=0.1, marker='*', label=sentiments[int(sentiment)])

#ax.scatter(data2.positive, data2.negative, c=[colors[int(k)] for k in data2.sentiment], s = 0.1, marker='*')  # Plot a dot for tweet
# Custom limits for this chart
plt.xlim(-200,40)
plt.ylim(-200,40)

plt.xlabel("Positive") # x-axis label
plt.ylabel("Negative") # y-axis label

data_pos = data2[data2.sentiment == 1] # Filter only the positive samples
data_neg = data[data2.sentiment == 0] # Filter only the negative samples

ax.legend(loc='lower right')

plt.show()
Entrenando naïve Bayes
Pasos:
- Obtener un conjunto de datos con tweets positivos y negativos
-
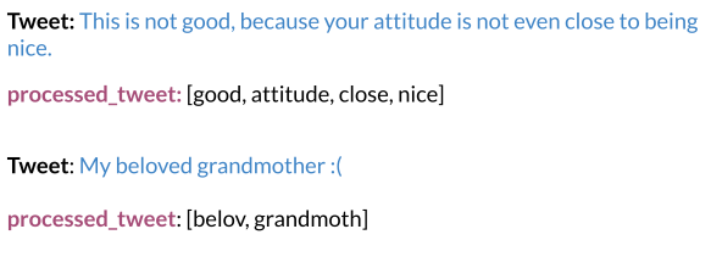
Preprocesar los tweets: procesar_tweet(tweet) ➞ [w1, w2, w3, ...]:
- Minúsculas
- Eliminar puntuación, URL, nombres
- Eliminar palabras vacías
- Derivación
- Tokenizar oraciones
-
Calcular frecuencia (w, clase)
- Obtener P(w|pos),P(w|neg)
- Obtener λ(w)
- Calcular logprior = log(P(pos) / P(neg)), el número de documentos positivos y negativos
import pdb
from nltk.corpus import stopwords, twitter_samples
import numpy as np
import pandas as pd
import nltk
import string
from nltk.tokenize import TweetTokenizer
from os import getcwd
import re
import string

from nltk.stem import PorterStemmer


nltk.download('twitter_samples')
nltk.download('stopwords')
filePath = f"{getcwd()}/../tmp2/"
nltk.data.path.append(filePath)
def process_tweet(tweet):
    '''
    Input:
        tweet: a string containing a tweet
    Output:
        tweets_clean: a list of words containing the processed tweet

    '''
    stemmer = PorterStemmer()
    stopwords_english = stopwords.words('english')
    # remove stock market tickers like $GE
    tweet = re.sub(r'\$\w*', '', tweet)
    # remove old style retweet text "RT"
    tweet = re.sub(r'^RT[\s]+', '', tweet)
    # remove hyperlinks
    tweet = re.sub(r'https?:\/\/.*[\r\n]*', '', tweet)
    # remove hashtags
    # only removing the hash # sign from the word
    tweet = re.sub(r'#', '', tweet)
    # tokenize tweets
    tokenizer = TweetTokenizer(preserve_case=False, strip_handles=True,
                               reduce_len=True)
    tweet_tokens = tokenizer.tokenize(tweet)

    tweets_clean = []
    for word in tweet_tokens:
        if (word not in stopwords_english and  # remove stopwords
            word not in string.punctuation):  # remove punctuation
            # tweets_clean.append(word)
            stem_word = stemmer.stem(word)  # stemming word
            tweets_clean.append(stem_word)

    return tweets_clean
def lookup(freqs, word, label):
    '''
    Input:
        freqs: a dictionary with the frequency of each pair (or tuple)
        word: the word to look up
        label: the label corresponding to the word
    Output:
        n: the number of times the word with its corresponding label appears.
    '''
    n = 0  # freqs.get((word, label), 0)

    pair = (word, label)
    if (pair in freqs):
        n = freqs[pair]

    return n
all_positive_tweets = twitter_samples.strings('positive_tweets.json')
all_negative_tweets = twitter_samples.strings('negative_tweets.json')

# split the data into two pieces, one for training and one for testing (validation set)
test_pos = all_positive_tweets[4000:]
train_pos = all_positive_tweets[:4000]
test_neg = all_negative_tweets[4000:]
train_neg = all_negative_tweets[:4000]

train_x = train_pos + train_neg
test_x = test_pos + test_neg

# avoid assumptions about the length of all_positive_tweets
train_y = np.append(np.ones(len(train_pos)), np.zeros(len(train_neg)))
test_y = np.append(np.ones(len(test_pos)), np.zeros(len(test_neg)))
custom_tweet = "RT @Twitter @chapagain Hello There! Have a great day. :) #good #morning http://chapagain.com.np"

# print cleaned tweet
print(process_tweet(custom_tweet))
def count_tweets(result, tweets, ys):
    '''
    Input:
        result: a dictionary that will be used to map each pair to its frequency
        tweets: a list of tweets
        ys: a list corresponding to the sentiment of each tweet (either 0 or 1)
    Output:
        result: a dictionary mapping each pair to its frequency
    '''
    for y, tweet in zip(ys, tweets):
        for word in process_tweet(tweet):
            # define the key, which is the word and label tuple
            pair = (word,y)

            # if the key exists in the dictionary, increment the count
            if pair in result:
                result[pair] += 1

            # else, if the key is new, add it to the dictionary and set the count to 1
            else:
                result[pair] = 1

    return result
result = {}
tweets = ['i am happy', 'i am tricked', 'i am sad', 'i am tired', 'i am tired']
ys = [1, 0, 0, 0, 0]
count_tweets(result, tweets, ys)
freqs = count_tweets({}, train_x, train_y)
def train_naive_bayes(freqs, train_x, train_y):
    '''
    Input:
        freqs: dictionary from (word, label) to how often the word appears
        train_x: a list of tweets
        train_y: a list of labels correponding to the tweets (0,1)
    Output:
        logprior: the log prior. (equation 3 above)
        loglikelihood: the log likelihood of you Naive bayes equation. (equation 6 above)
    '''
    loglikelihood = {}
    logprior = 0

    # calculate V, the number of unique words in the vocabulary
    vocab = set([tupla[0] for tupla in freqs])
    V = len(vocab)

    # calculate N_pos, N_neg, V_pos, V_neg
    N_pos = N_neg = 0
    for pair in freqs.keys():
        # if the label is positive (greater than zero)
        if pair[1] > 0:
            # Increment the number of positive words by the count for this (word, label) pair
            N_pos += freqs[pair]

        # else, the label is negative
        else:

            # increment the number of negative words by the count for this (word,label) pair
            N_neg += freqs[pair]

    # Calculate D, the number of documents
    D = len(train_y)

    # Calculate D_pos, the number of positive documents
    D_pos = sum(train_y)

    # Calculate D_neg, the number of negative documents
    D_neg = D-D_pos

    # Calculate logprior
    logprior = np.log(D_pos)-np.log(D_neg)

    # For each word in the vocabulary...
    for word in vocab:
        # get the positive and negative frequency of the word
        if (word,1) in freqs:
            freq_pos = freqs[word,1]
        else:
            freq_pos = 0
        if (word,0) in freqs:
            freq_neg = freqs[word,0]
        else:
            freq_neg = 0

        # calculate the probability that each word is positive, and negative
        p_w_pos = (freq_pos+1)/(N_pos+V)
        p_w_neg = (freq_neg+1)/(N_neg+V)


        # calculate the log likelihood of the word
        loglikelihood[word] = np.log(p_w_pos)- np.log(p_w_neg)

    ### END CODE HERE ###
    return logprior, loglikelihood
logprior, loglikelihood = train_naive_bayes(freqs, train_x, train_y)
print(logprior)
print(len(loglikelihood))
def naive_bayes_predict(tweet, logprior, loglikelihood):
    '''
    Input:
        tweet: a string
        logprior: a number
        loglikelihood: a dictionary of words mapping to numbers
    Output:
        p: the sum of all the logliklihoods of each word in the tweet (if found in the dictionary) + logprior (a number)

    '''
    # process the tweet to get a list of words
    word_l = process_tweet(tweet)
    # initialize probability to zero
    p = 0
    # add the logprior
    p += logprior
    for word in word_l:

        # check if the word exists in the loglikelihood dictionary
        if word in loglikelihood:
            # add the log likelihood of that word to the probability
            p += loglikelihood[word]
    return p
my_tweet = 'She smiled.'
p = naive_bayes_predict(my_tweet, logprior, loglikelihood)
print('The expected output is', p)
def test_naive_bayes(test_x, test_y, logprior, loglikelihood, naive_bayes_predict=naive_bayes_predict):
    """
    Input:
        test_x: A list of tweets
        test_y: the corresponding labels for the list of tweets
        logprior: the logprior
        loglikelihood: a dictionary with the loglikelihoods for each word
    Output:
        accuracy: (# of tweets classified correctly)/(total # of tweets)
    """
    accuracy = 0  # return this properly

    y_hats = []
    for tweet in test_x:
        # if the prediction is > 0
        if naive_bayes_predict(tweet, logprior, loglikelihood) > 0:
            # the predicted class is 1
            y_hat_i = 1
        else:
            # otherwise the predicted class is 0
            y_hat_i = 0

        # append the predicted class to the list y_hats
        y_hats.append(y_hat_i)

    # error is the average of the absolute values of the differences between y_hats and test_y
    error = sum(abs(y_hats-test_y))/len(test_y)

    # Accuracy is 1 minus the error
    accuracy = 1-error

    return accuracy
print("Naive Bayes accuracy = %0.4f" %
      (test_naive_bayes(test_x, test_y, logprior, loglikelihood)))
for tweet in ['I am happy', 'I am bad', 'this movie should have been great.', 'great', 'great great', 'great great great', 'great great great great']:
    p = naive_bayes_predict(tweet, logprior, loglikelihood)
    print(f'{tweet} -> {p:.2f}')

