1.1- NLP: Analisis del Sentimiento con regresión logística
Procesamiento del lenguaje natural con Clasificación y Espacios Vectoriales
- Preprocesamiento de los datos
- Clasificador de regresión logística para realizar el análisis de sentimiento en tweets
Preprocesamiento de los datos
El primer paso va a ser siempre tratar los datos para poder utilizarlos después en algún modelo de clasificación o regresión.
- Cargamos las librerías necesarias
- Cargamos los datos de una base de ejemplo de la librería nltk (muy útil para procesamiento de texto)
- Procesamos los datos:
- Quitar elementos poco útiles en este caso: hyperlinks, marcas y estilos de twitter
- Tokenizamos las cadenas: separamos los tweets o frases en palabras
- Quitamos las stopwords o palabras vacías (no tienen un significado por sí solas, sino que modifican o acompañan a otras)
- Se realiza el stemming o derivación, dejando las palabras sólo con la raiz que tiene más significado.
- Pasar a minúsculas
import nltk                                # Python library for NLP
from nltk.corpus import twitter_samples   # sample Twitter dataset from NLTK
import matplotlib.pyplot as plt            # library for visualization
import random                            # pseudo-random number generator
import numpy as np
nltk.download('twitter_samples')
all_positive_tweets = twitter_samples.strings('positive_tweets.json')
all_negative_tweets = twitter_samples.strings('negative_tweets.json')
print('Number of positive tweets: ', len(all_positive_tweets))
print('Number of negative tweets: ', len(all_negative_tweets))

print('\nThe type of all_positive_tweets is: ', type(all_positive_tweets))
print('The type of a tweet entry is: ', type(all_negative_tweets[0]))
print('\033[92m' + all_positive_tweets[random.randint(0,5000)])

# print negative in red
print('\033[91m' + all_negative_tweets[random.randint(0,5000)])
nltk.download('stopwords')
import re                                  # library for regular expression operations
import string                              # for string operations

from nltk.corpus import stopwords          # module for stop words that come with NLTK
from nltk.stem import PorterStemmer        # module for stemming
from nltk.tokenize import TweetTokenizer   # module for tokenizing strings
tweet = all_positive_tweets[2277]
print('\033[92m' + tweet)
print('\033[94m')

# remove old style retweet text "RT"
tweet2 = re.sub(r'^RT[\s]+', '', tweet)

# remove hyperlinks
tweet2 = re.sub(r'https?://[^\s\n\r]+', '', tweet2)

# remove hashtags
# only removing the hash # sign from the word
tweet2 = re.sub(r'#', '', tweet2)

print(tweet2)
tokenizer = TweetTokenizer(preserve_case=False, strip_handles=True,
                               reduce_len=True)
# tokenize tweets
tweet_tokens = tokenizer.tokenize(tweet2)

print(tweet_tokens)
stopwords_english = stopwords.words('english')

print('Stop words\n')
print(stopwords_english)

print('\nPunctuation\n')
print(string.punctuation)
tweets_clean = []

for word in tweet_tokens: # Go through every word in your tokens list
    if (word not in stopwords_english and  # remove stopwords
        word not in string.punctuation):  # remove punctuation
        tweets_clean.append(word)

print('removed stop words and punctuation:')
print(tweets_clean)
stemmer = PorterStemmer()

# Create an empty list to store the stems
tweets_stem = []

for word in tweets_clean:
    stem_word = stemmer.stem(word)  # stemming word
    tweets_stem.append(stem_word)  # append to the list

print('stemmed words:')
print(tweets_stem)
cadena= "Hola. Me llamo Pedro"
print(cadena.lower())
Clasificador de regresión logística para realizar el análisis de sentimiento en tweets
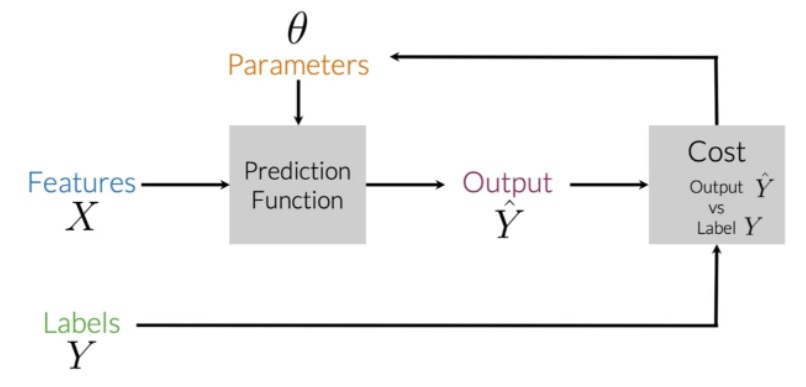
En el aprendizaje automático supervisado, generalmente se tiene una entrada X, que aplicada a la función de predicción se obtiene la Y'.
Luego puede comparar su predicción con el valor real Y. Esto le da su costo que usa para actualizar los parámetros θ.
Para más detalles consulta este post: Proceso de aprendizaje automático supervisado
La siguiente imagen resume el proceso:
Análisis de sentimiento en un tweet:
- X -> el texto (es decir, "I am happy because I am learning NLP") como características
- Entrenar
- Clasificar el texto.
Vocabulario = V (1..n): conjunto de palabras únicas Extracción de características: 1 en el índice correspondiente para cualquier palabra del tuit y 0 en caso contrario.
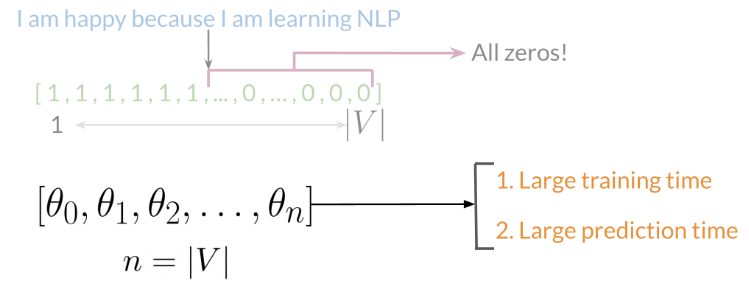
A medida que V crece, el vector se vuelve más disperso. Las representaciones dispersas son problemáticas para los tiempos de entrenamiento y predicción.

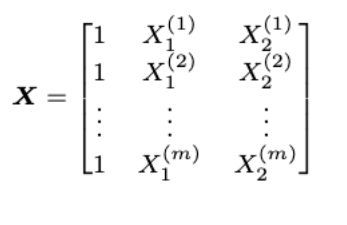
Vector de características [1,8,11]. 1 corresponde al sesgo, 8 a la característica positiva y 11 a la característica negativa.
def process_tweet(tweet):
    """Process tweet.
    Input:
        tweet

    Output:
        tweet processed
    """
    tweet2 = re.sub(r'^RT[\s]+', '', tweet)
    tweet2 = re.sub(r'https?://[^\s\n\r]+', '', tweet2)
    tweet2 = re.sub(r'#', '', tweet2)
    tokenizer = TweetTokenizer(preserve_case=False, strip_handles=True,
                               reduce_len=True)
    tweet_tokens = tokenizer.tokenize(tweet2)
    tweets_clean = []

    for word in tweet_tokens: # Go through every word in your tokens list
        if (word not in stopwords_english and  # remove stopwords
            word not in string.punctuation):  # remove punctuation
            tweets_clean.append(word)
    stemmer = PorterStemmer()
    tweets_stem = []
    for word in tweets_clean:
        stem_word = stemmer.stem(word)  # stemming word
        tweets_stem.append(stem_word)  # append to the list
    tweets_processed = []
    for word in tweets_stem:
        processed_word = word.lower()  # stemming word
        tweets_processed.append(processed_word)  # append to the list
    return tweets_processed
def build_freqs(tweets, ys):
    """Build frequencies.
    Input:
        tweets: a list of tweets
        ys: an m x 1 array with the sentiment label of each tweet
            (either 0 or 1)
    Output:
        freqs: a dictionary mapping each (word, sentiment) pair to its
        frequency
    """
    # Convert np array to list since zip needs an iterable.
    # The squeeze is necessary or the list ends up with one element.
    # Also note that this is just a NOP if ys is already a list.
    yslist = np.squeeze(ys).tolist()

    # Start with an empty dictionary and populate it by looping over all tweets
    # and over all processed words in each tweet.
    freqs = {}
    for y, tweet in zip(yslist, tweets):
        for word in process_tweet(tweet):
            pair = (word, y)
            if pair in freqs:
                freqs[pair] += 1
            else:
                freqs[pair] = 1
    return freqs
tweets = all_positive_tweets + all_negative_tweets
# make a numpy array representing labels of the tweets
labels = np.append(np.ones((len(all_positive_tweets))), np.zeros((len(all_negative_tweets))))
freqs = build_freqs(tweets, labels)

# check data type
print(f'type(freqs) = {type(freqs)}')

# check length of the dictionary
print(f'len(freqs) = {len(freqs)}')
tweet = all_positive_tweets[2277]
print(process_tweet(tweet))
print(freqs)
def extract_features(tweet, freqs, process_tweet=process_tweet):
    '''
    Input:
        tweet: a list of words for one tweet
        freqs: a dictionary corresponding to the frequencies of each tuple (word, label)
    Output:
        x: a feature vector of dimension (1,3)
    '''
    # process_tweet tokenizes, stems, and removes stopwords
    word_l = process_tweet(tweet)

    # 3 elements in the form of a 1 x 3 vector
    x = np.zeros((1, 3))

    #bias term is set to 1
    x[0,0] = 1

    # loop through each word in the list of words
    for word in word_l:

        # increment the word count for the positive label 1
        if (word,1) in freqs:
            x[0,1] += freqs[word,1]

        # increment the word count for the negative label 0
        if (word,0) in freqs:
            x[0,2] += freqs[word,0]

    assert(x.shape == (1, 3))
    return x
ejemplo_tweet =tweets[1]
print(ejemplo_tweet)
extract_features(ejemplo_tweet, freqs, process_tweet)
data = []

for tweet in tweets:
    for word in process_tweet(tweet):

         # initialize positive and negative counts
        pos = 0
        neg = 0

        # retrieve number of positive counts
        if (word, 1) in freqs:
            pos = freqs[(word, 1)]

        # retrieve number of negative counts
        if (word, 0) in freqs:
            neg = freqs[(word, 0)]

        # append the word counts to the table
        data.append([word, pos, neg])

data
data1= data[200:250]
fig, ax = plt.subplots(figsize = (8, 8))

# convert positive raw counts to logarithmic scale. we add 1 to avoid log(0)
x = np.log([x[1] + 1 for x in data1])

# do the same for the negative counts
y = np.log([x[2] + 1 for x in data1])

# Plot a dot for each pair of words
ax.scatter(x, y)

# assign axis labels
plt.xlabel("Log Positive count")
plt.ylabel("Log Negative count")

# Add the word as the label at the same position as you added the points just before
for i in range(0, len(data1)):
    ax.annotate(data1[i][0], (x[i], y[i]), fontsize=12)

ax.plot([0, 9], [0, 9], color = 'red') # Plot the red line that divides the 2 areas.
plt.show()
data[:20]
import math
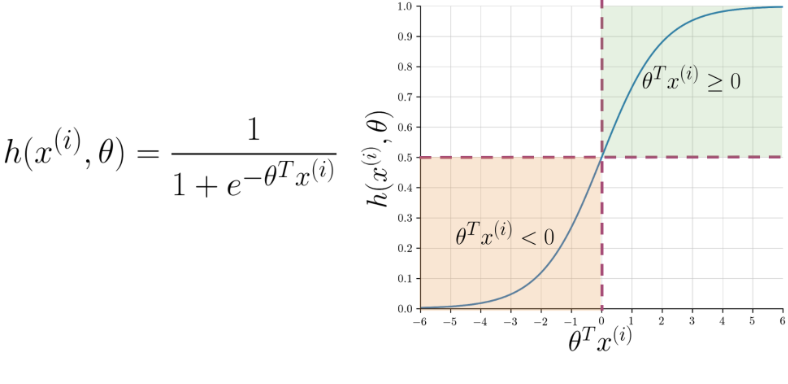
def sigmoid(z):
    '''
    Input:
        z: is the input (can be a scalar or an array)
    Output:
        h: the sigmoid of z
    '''
    return 1 / ( 1 + np.exp(-z))
Descenso del gradiente
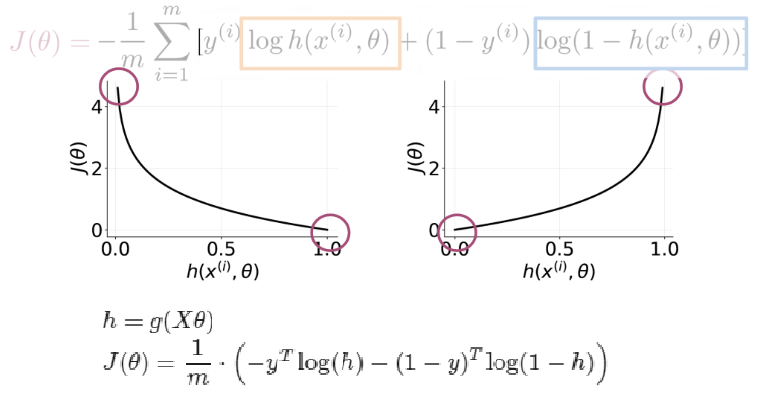
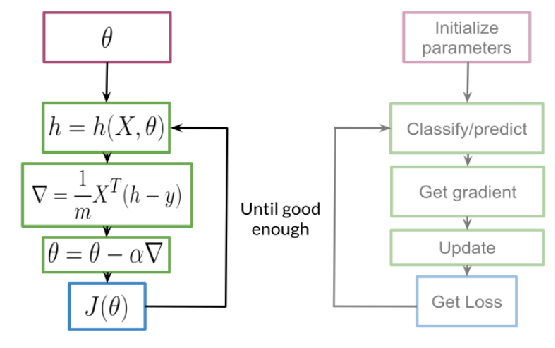
Consiste en moverse por la función de coste (error) buscando el punto donde se minimiza. Para ello, en cada posición, busca la dirección en la que se reduce más el error. Esto se obtiene con la derivada parcial en el punto respecto de cáda parámetro (el gradiente de la función), que es la pendiente de la curva.
Una vez obtenida la dirección en que hay que moverse se recalculan los parámetros de la siguiente forma:

def gradientDescent(x, y, theta, alpha , num_iters):
    '''
    Input:
        x: matrix of features which is (m,n+1)
        y: corresponding labels of the input matrix x, dimensions (m,1)
        theta: weight vector of dimension (n+1,1)
        alpha: learning rate
        num_iters: number of iterations you want to train your model for
    Output:
        J: the final cost
        theta: your final weight vector
    Hint: you might want to print the cost to make sure that it is going down.
    '''
    # get 'm', the number of rows in matrix x
    m = len(x[0:])

    for i in range(0, num_iters):

        # get z, the dot product of x and theta
        z =  x @ theta
        # get the sigmoid of z
        h =sigmoid(z)

        # calculate the cost function

        J = -(1/m)* (y.T @ np.log(h)+((1-y).T @ np.log(1-h)))

        # update the weights theta
        theta = theta - alpha/m  * (x.T @ (h-y))
        #print(f"iter: {i}")

    J = float(J)
    return J, theta
train_x= tweets[:8000]
train_y= np.reshape(np.array(labels[:8000]),(8000,1))
print("train_y.shape = " + str(train_y.shape))
X = np.zeros((len(train_x), 3))
for i in range(len(train_x)):
    X[i, :]= extract_features(train_x[i], freqs)

# training labels corresponding to X
Y = train_y

# Apply gradient descent
J, theta = gradientDescent(X, Y, np.zeros((3, 1)), 1e-9, 2900)
print(f"The cost after training is {J:.8f}.")
print(f"The resulting vector of weights is {[round(t, 8) for t in np.squeeze(theta)]}")
test_x= tweets[8000:]
test_y= labels[8000:]
def predict_tweet(tweet, freqs, theta):
    '''
    Input:
        tweet: a string
        freqs: a dictionary corresponding to the frequencies of each tuple (word, label)
        theta: (3,1) vector of weights
    Output:
        y_pred: the probability of a tweet being positive or negative
    '''
    # extract the features of the tweet and store it into x
    x = extract_features(tweet, freqs)

    # make the prediction using x and theta
    y_pred = sigmoid(x @ theta)

    return y_pred
for tweet in ['I am happy', 'I am bad', 'this movie should have been great.', 'great', 'great great', 'great great great', 'great great great great']:
    print( '%s -> %f' % (tweet, predict_tweet(tweet, freqs, theta)))
def test_logistic_regression(test_x, test_y, freqs, theta, predict_tweet=predict_tweet):
    """
    Input:
        test_x: a list of tweets
        test_y: (m, 1) vector with the corresponding labels for the list of tweets
        freqs: a dictionary with the frequency of each pair (or tuple)
        theta: weight vector of dimension (3, 1)
    Output:
        accuracy: (# of tweets classified correctly) / (total # of tweets)
    """
    m = len(test_x[0:])

    # the list for storing predictions
    y_hat = []

    for tweet in test_x:
        # get the label prediction for the tweet
        y_pred = predict_tweet(tweet, freqs, theta)

        if y_pred > 0.5:
            # append 1.0 to the list
            y_hat.append(1.0)
        else:
            # append 0 to the list
            y_hat.append(0.0)

    # With the above implementation, y_hat is a list, but test_y is (m,1) array
    # convert both to one-dimensional arrays in order to compare them using the '==' operator

    accuracy = np.sum(test_y.T==np.asarray(y_hat))/len(test_y)

    return accuracy
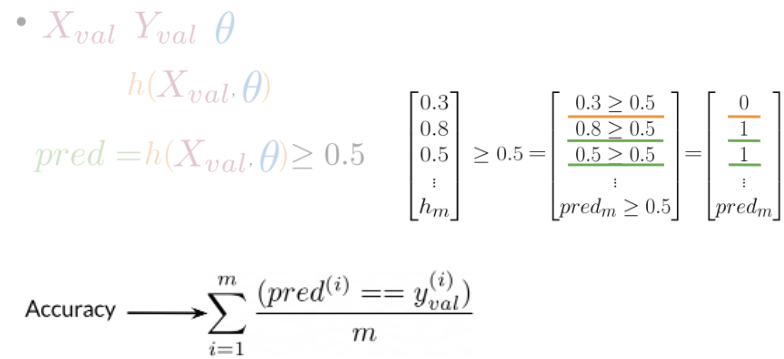
tmp_accuracy = test_logistic_regression(test_x, test_y, freqs, theta)
print(f"Logistic regression model's accuracy = {tmp_accuracy:.4f}")
my_tweet = 'This is a ridiculously bright movie. The plot was terrible and I was sad until the ending!'
print(process_tweet(my_tweet))
y_hat = predict_tweet(my_tweet, freqs, theta)
print(y_hat)
if y_hat > 0.5:
    print('Positive sentiment')
else:
    print('Negative sentiment')