1.3- NLP: Modelos de Espacios Vectoriales
Procesamiento del lenguaje natural con Clasificación y Espacios Vectoriales
- Conocimiento previo
- Predecir relaciones entre palabras
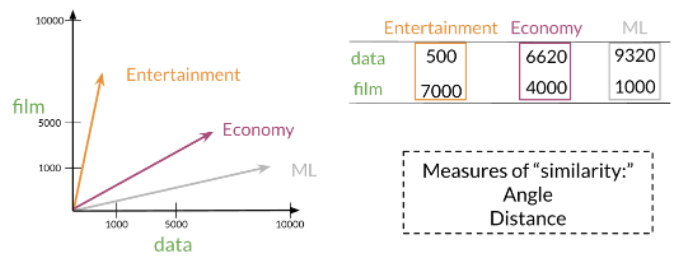
Los modelos de espacio vectorial capturan el significado semántico y las relaciones entre palabras.
import pandas as pd # Library for Dataframes
import numpy as np # Library for math functions
import pickle # Python object serialization library. Not secure

word_embeddings = pickle.load( open( "./data/word_embeddings_subset.p", "rb" ) )
len(word_embeddings) # there should be 243 words that will be used in this assignment
countryVector = word_embeddings['country'] # Get the vector representation for the word 'country'
print(type(countryVector)) # Print the type of the vector. Note it is a numpy array
print(countryVector) # Print the values of the vector.
def vec(w):
    return word_embeddings[w]
import matplotlib.pyplot as plt # Import matplotlib
%matplotlib inline

words = ['oil', 'gas', 'happy', 'sad', 'city', 'town', 'village', 'country', 'continent', 'petroleum', 'joyful']

bag2d = np.array([vec(word) for word in words]) # Convert each word to its vector representation

fig, ax = plt.subplots(figsize = (10, 10)) # Create custom size image

col1 = 3 # Select the column for the x axis
col2 = 2 # Select the column for the y axis

# Print an arrow for each word
for word in bag2d:
    ax.arrow(0, 0, word[col1], word[col2], head_width=0.005, head_length=0.005, fc='r', ec='r', width = 1e-5)


ax.scatter(bag2d[:, col1], bag2d[:, col2]); # Plot a dot for each word

# Add the word label over each dot in the scatter plot
for i in range(0, len(words)):
    ax.annotate(words[i], (bag2d[i, col1], bag2d[i, col2]))


plt.show()
words = ['sad', 'happy', 'town', 'village']

bag2d = np.array([vec(word) for word in words]) # Convert each word to its vector representation

fig, ax = plt.subplots(figsize = (10, 10)) # Create custom size image

col1 = 3 # Select the column for the x axe
col2 = 2 # Select the column for the y axe

# Print an arrow for each word
for word in bag2d:
    ax.arrow(0, 0, word[col1], word[col2], head_width=0.0005, head_length=0.0005, fc='r', ec='r', width = 1e-5)

# print the vector difference between village and town
village = vec('village')
town = vec('town')
diff = town - village
ax.arrow(village[col1], village[col2], diff[col1], diff[col2], fc='b', ec='b', width = 1e-5)

# print the vector difference between village and town
sad = vec('sad')
happy = vec('happy')
diff = happy - sad
ax.arrow(sad[col1], sad[col2], diff[col1], diff[col2], fc='b', ec='b', width = 1e-5)


ax.scatter(bag2d[:, col1], bag2d[:, col2]); # Plot a dot for each word

# Add the word label over each dot in the scatter plot
for i in range(0, len(words)):
    ax.annotate(words[i], (bag2d[i, col1], bag2d[i, col2]))


plt.show()
keys = word_embeddings.keys()
data = []
for key in keys:
    data.append(word_embeddings[key])

embedding = pd.DataFrame(data=data, index=keys)
# Define a function to find the closest word to a vector:
def find_closest_word(v, k = 1):
    # Calculate the vector difference from each word to the input vector
    diff = embedding.values - v
    # Get the norm of each difference vector.
    # It means the squared euclidean distance from each word to the input vector
    delta = np.sum(diff * diff, axis=1)
    # Find the index of the minimun distance in the array
    i = np.argmin(delta)
    # Return the row name for this item
    return embedding.iloc[i].name
embedding.head(10)
capital = vec('France') - vec('Paris')
country = vec('Madrid') + capital
find_closest_word(country)
Análisis de componentes principales - Principal component analysis (PCA)
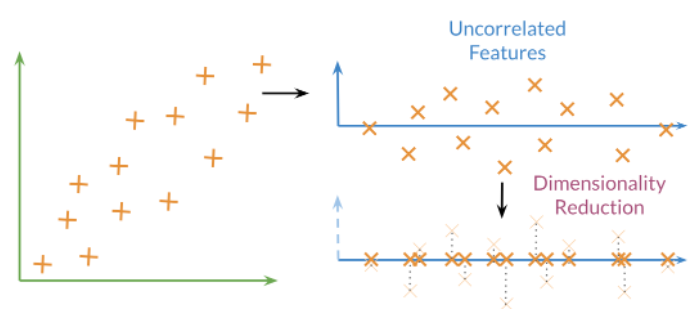
- Algoritmo de aprendizaje no supervisado que se puede utilizar para reducir la dimensión de sus datos.
-
El modelo colapsa los datos a través de los componentes principales.
-
Utiliza transformaciones ortogonales para mapear un conjunto de variables en un conjunto de variables linealmente no correlacionadas llamadas componentes principales
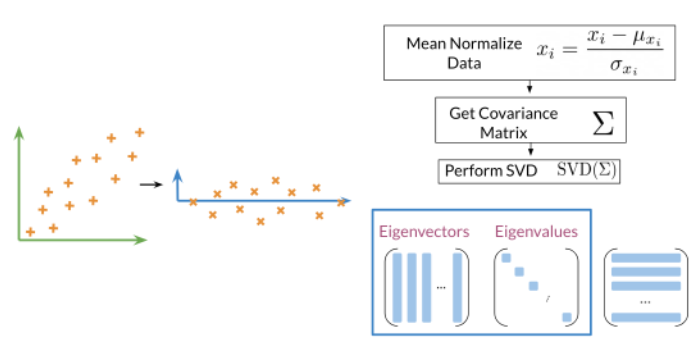
- PCA se basa en la descomposición de valor singular (SVD) de la matriz de covarianza del conjunto de datos original.
-
Vector propio (Eigenvector): los vectores resultantes, también conocidos como características no correlacionadas de sus datos = matriz de rotación
-
Valor propio (Eigenvalue): la cantidad de información retenida por cada característica nueva. Puedes pensar en ello como la varianza en el vector propio.
-
Además, cada valor propio tiene un vector propio correspondiente. El valor propio te dice cuánta varianza hay en el vector propio.
Pasos para calcular PCA:
- Halla la media para normalizar sus datos
- Calcular la matriz de covarianza
-
Calcule SVD en su matriz de covarianza. Esto devuelve [U S V] = svd(Σ). Las tres matrices U, S, V se dibujan arriba. U está etiquetado con vectores propios y S está etiquetado con valores propios.
-
Luego puede usar las primeras n columnas del vector U para obtener sus nuevos datos multiplicando XU[:, 0:n].
import matplotlib.pyplot as plt            # library for visualization
from sklearn.decomposition import PCA      # PCA library
import math                                # Library for math functions
import random                              # Library for pseudo random numbers
import matplotlib.lines as mlines
import matplotlib.transforms as mtransforms
np.random.seed(100)

std1 = 1     # The desired standard deviation of our first random variable
std2 = 0.333 # The desired standard deviation of our second random variable

x = np.random.normal(0, std1, 1000) # Get 1000 samples from x ~ N(0, std1)
y = np.random.normal(0, std2, 1000)  # Get 1000 samples from y ~ N(0, std2)
#y = y + np.random.normal(0,1,1000)*noiseLevel * np.sin(0.78)

# PCA works better if the data is centered
x = x - np.mean(x) # Center x
y = y - np.mean(y) # Center y

#Define a pair of dependent variables with a desired amount of covariance
n = 1 # Magnitude of covariance.
angle = np.arctan(1 / n) # Convert the covariance to and angle
print('angle: ',  angle * 180 / math.pi)

# Create a rotation matrix using the given angle
rotationMatrix = np.array([[np.cos(angle), np.sin(angle)],
                 [-np.sin(angle), np.cos(angle)]])


print('rotationMatrix')
print(rotationMatrix)

xy = np.concatenate(([x] , [y]), axis=0).T # Create a matrix with columns x and y

# Transform the data using the rotation matrix. It correlates the two variables
data = np.dot(xy, rotationMatrix) # Return a nD array

# Print the rotated data
plt.scatter(data[:,0], data[:,1])
plt.show()
# result of the PCA in the same plot alongside with the 2 Principal
# Component vectors in red and blue

plt.scatter(data[:,0], data[:,1]) # Print the original data in blue

# Apply PCA. In theory, the Eigenvector matrix must be the
# inverse of the original rotationMatrix.
pca = PCA(n_components=2)  # Instantiate a PCA. Choose to get 2 output variables

# Create the transformation model for this data. Internally it gets the rotation
# matrix and the explained variance
pcaTr = pca.fit(data)

# Create an array with the transformed data
dataPCA = pcaTr.transform(data)

print('Eigenvectors or principal component: First row must be in the direction of [1, n]')
print(pcaTr.components_)

print()
print('Eigenvalues or explained variance')
print(pcaTr.explained_variance_)

# Print the rotated data
plt.scatter(dataPCA[:,0], dataPCA[:,1])

# Plot the first component axe. Use the explained variance to scale the vector
plt.plot([0, rotationMatrix[0][0] * std1 * 3], [0, rotationMatrix[0][1] * std1 * 3], 'k-', color='red')
# Plot the second component axe. Use the explained variance to scale the vector
plt.plot([0, rotationMatrix[1][0] * std2 * 3], [0, rotationMatrix[1][1] * std2 * 3], 'k-', color='green')

plt.show()
- La matriz de rotación utilizada para crear nuestras variables correlacionadas tomó las variables originales no correlacionadas x e y y las transformó en los puntos azules.
- La transformación PCA descubre la matriz de rotación utilizada para crear nuestras variables correlacionadas (puntos azules).
- Usando el modelo PCA para transformar nuestros datos, vuelve a colocar las variables como nuestras variables originales no correlacionadas.
PCA como estrategia para la reducción de la dimensionalidad
Los primeros componentes conservan la mayor parte del poder de los datos para explicar los patrones que generalizan los datos.
PCA como estrategia para mostra graficos de datos complejos
Las imágenes en bruto se componen de cientos o incluso miles de características. Sin embargo, PCA nos permite reducir tantas funciones a solo dos. En ese espacio reducido de variables no correlacionadas, podemos separar fácilmente perros y gatos.
def get_vectors(embeddings, words):
    """
    Input:
        embeddings: a word
        fr_embeddings:
        words: a list of words
    Output:
        X: a matrix where the rows are the embeddings corresponding to the rows on the list

    """
    m = len(words)
    X = np.zeros((1, 300))
    for word in words:
        english = word
        eng_emb = embeddings[english]
        X = np.row_stack((X, eng_emb))
    X = X[1:,:]
    return X
data = pd.read_csv('./data/capitals.txt', delimiter=' ')
data.columns = ['city1', 'country1', 'city2', 'country2']

# print first five elements in the DataFrame
data.head(5)
print("dimension: {}".format(word_embeddings['Spain'].shape[0]))
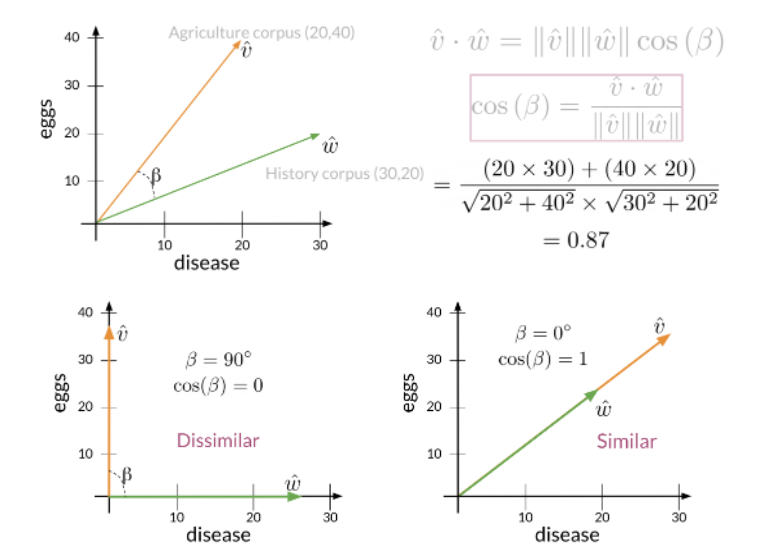
def cosine_similarity(A, B):
    '''
    Input:
        A: a numpy array which corresponds to a word vector
        B: A numpy array which corresponds to a word vector
    Output:
        cos: numerical number representing the cosine similarity between A and B.
    '''
    dot = np.dot(A,B)
    norma = np.linalg.norm(A)
    normb = np.linalg.norm(B)
    cos = dot/(norma*normb)
    return cos
king = word_embeddings['king']
queen = word_embeddings['queen']
cosine_similarity(king, queen)
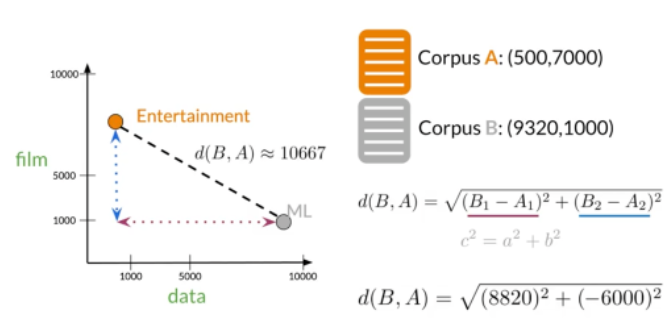
def euclidean(A, B):
    """
    Input:
        A: a numpy array which corresponds to a word vector
        B: A numpy array which corresponds to a word vector
    Output:
        d: numerical number representing the Euclidean distance between A and B.
    """
    d = np.sqrt(np.sum((A-B)**2))
    return d
euclidean(king, queen)
def get_country(city1, country1, city2, embeddings, cosine_similarity=cosine_similarity):
    """
    Input:
        city1: a string (the capital city of country1)
        country1: a string (the country of capital1)
        city2: a string (the capital city of country2)
        # CODE REVIEW COMMENT: Embedding incomplete code comment, should add "and values are their emmbeddings"
        embeddings: a dictionary where the keys are words and
    Output:
        countries: a dictionary with the most likely country and its similarity score
    """
    group = {city1,country1,city2}   # store the city1, country 1, and city 2 in a set called group
    city1_emb = embeddings[city1]   # get embeddings of city 1
    country1_emb = embeddings[country1] # get embedding of country 1
    city2_emb = embeddings[city2]   # get embedding of city 2

    vec = country1_emb - city1_emb + city2_emb

    # Initialize the similarity to -1 (it will be replaced by a similarities that are closer to +1)
    similarity = -1

    # initialize country to an empty string
    country = ''

    # loop through all words in the embeddings dictionary
    for word in embeddings.keys():

        # first check that the word is not already in the 'group'
        if word not in group:

            # get the word embedding
            word_emb = embeddings[word]

            # calculate cosine similarity between embedding of country 2 and the word in the embeddings dictionary
            cur_similarity = cosine_similarity(vec, word_emb)

            # if the cosine similarity is more similar than the previously best similarity...
            if cur_similarity > similarity:

                # update the similarity to the new, better similarity
                similarity = cur_similarity

                # store the country as a tuple, which contains the word and the similarity
                country = (word,similarity )

    return country
get_country('Athens', 'Greece', 'Lisbon', word_embeddings)
def get_accuracy(word_embeddings, data, get_country=get_country):
    '''
    Input:
    # CODE REVIEW COMMENT: This comment seems incomplete it should be data: a pandas dataframe containing all the country and capital city pairs
        word_embeddings: a dictionary where the key is a word and the value is its embedding
        data: a pandas data frame as
    '''
    # initialize num correct to zero
    num_correct = 0
    # loop through the rows of the dataframe
    for i, row in data.iterrows():
        city1 = row[0]   # get city1
        country1 = row[1]  # get country1
        city2 = row[2]    # get city2
        country2 = row[3]   # get country2

        # use get_country to find the predicted country2
        predicted_country2, _ = get_country(city1, country1, city2, word_embeddings, cosine_similarity=cosine_similarity)

        # if the predicted country2 is the same as the actual country2...
        if predicted_country2 == country2:
            # increment the number of correct by 1
            num_correct += 1

    # get the number of rows in the data dataframe (length of dataframe)
    m = len(data)

    # calculate the accuracy by dividing the number correct by m
    accuracy = num_correct / m

    return accuracy
accuracy = get_accuracy(word_embeddings, data)
print(f"Accuracy is {accuracy:.2f}")
def compute_pca(X, n_components=2):
    """
    Input:
        X: of dimension (m,n) where each row corresponds to a word vector
        n_components: Number of components you want to keep.
    Output:
        X_reduced: data transformed in 2 dims/columns + regenerated original data
    pass in: data as 2D NumPy array
    """
    # mean center the data
    X_demeaned = X - np.mean(X,  axis=0)
    # calculate the covariance matrix
    covariance_matrix = np.cov(X_demeaned.T)
    # calculate eigenvectors & eigenvalues of the covariance matrix
    eigen_vals , eigen_vecs  = np.linalg.eigh(covariance_matrix)

    # sort eigenvalue in increasing order (get the indices from the sort)
    idx_sorted = np.argsort(eigen_vals)

    # reverse the order so that it's from highest to lowest.
    idx_sorted_decreasing = idx_sorted[::-1]

    # sort the eigen values by idx_sorted_decreasing
    eigen_vals_sorted = eigen_vals[idx_sorted_decreasing]

    # sort eigenvectors using the idx_sorted_decreasing indices
    eigen_vecs_sorted = eigen_vecs[:,idx_sorted_decreasing]

    # select the first n eigenvectors (n is desired dimension
    # of rescaled data array, or dims_rescaled_data)
    eigen_vecs_subset = eigen_vecs_sorted [:,:n_components]

    # transform the data by multiplying the transpose of the eigenvectors with the transpose of the de-meaned data
    # Then take the transpose of that product.
    X_reduced = np.dot(eigen_vecs_subset.T,X_demeaned.T).T

    return X_reduced
np.random.seed(1)
X = np.random.rand(3, 10)
X_reduced = compute_pca(X, n_components=2)
print("Your original matrix was " + str(X.shape) + " and it became:")
print(X_reduced)
words = ['oil', 'gas', 'happy', 'sad', 'city', 'town',
         'village', 'country', 'continent', 'petroleum', 'joyful']

# given a list of words and the embeddings, it returns a matrix with all the embeddings
X = get_vectors(word_embeddings, words)

print('You have 11 words each of 300 dimensions thus X.shape is:', X.shape)
result = compute_pca(X, 2)
plt.scatter(result[:, 0], result[:, 1])
for i, word in enumerate(words):
    plt.annotate(word, xy=(result[i, 0] - 0.05, result[i, 1] + 0.1))

plt.show()
 v=[2,1,1,0]